A New Way to Benefit from Cyber Risk Quantification
According to Gartner, Security and Risk-Management (SRM) leaders are turning to cyber-risk quantification (CRQ) to communicate risk, aid enterprise decision making, and prioritize cybersecurity risks with greater precision.
Cyber Risk Quantification (CRQ) is a valuable tool to help organizations determine the potential financial impact if identified gaps in security controls were to be exploited. CRQ results can help prioritize budgets, evaluate the cost-benefit of new controls, and communicate to the board in familiar financial terms.
However, CRQ can be challenging to implement. Let’s examine some of those challenges and how they might be addressed.
CRQ in Practice Presents Challenges
One of the biggest challenges with CRQ today is the lack of common industry terminology that defines what risk is, invariably making it very difficult to determine the appropriate elements to measure it; a problem exacerbated for larger and more complex operational environments. Therefore, CRQ models, like FAIR™ and Open FAIR™ [i] can be only as useful to present cyber risk in financial terms as the inputs entered, frequently resulting in inconsistent risk quantification metrics, based on different assumptions.
CRQ can also be complicated to use. Risk modeling requires deep expertise of the employed model as well as of the organization and requires multiple sources of information: the organization’s own data and security capability maturity, industry historical loss data, and more. Many organizations could benefit from guidance in defining threat scenarios, such as ransomware, DDoS, data breaches and phishing.
Making the CRQ Process Repeatable and Calculations more Refined
A valuable approach to ensure a consistent and repeatable CRQ process is to map risk into established best practices. An example can be seen in “Calculating the Effect of NIST CSF Maturity Levels on Risk Reduction”[ii]. Maturity levels are first mapped to Resistance probability distributions, and then the expected risk is calculated at the Vulnerability level for existing (inherent) risk, and at the desired maturity level for residual risk (to simulate the impact after adding a new control). By utilizing this mapping, organizations see CRQ results tailored to their specific maturity levels and risk tolerance, which aids decision making to select controls with highest ROI.
Addressing the challenge of expertise and breadth of data calls for guidance in the process of defining scenarios and comparing relative risk. Here again the mapping of NIST Maturity Levels and their associated Resistance probability distributions can help by allowing the organization to assess risk through a comparison of the average and maximum values of Annual Loss Expectancy (ALE). As shown in the report on the effects of NIST CSF Maturity Scores mentioned above, a table of suggested Risk Factor values for each of the Maturity Levels can prove useful in driving the model. When aligned with the organization’s industry, historical loss data, and size, this guidance can help organizations accelerate risk modeling activities.
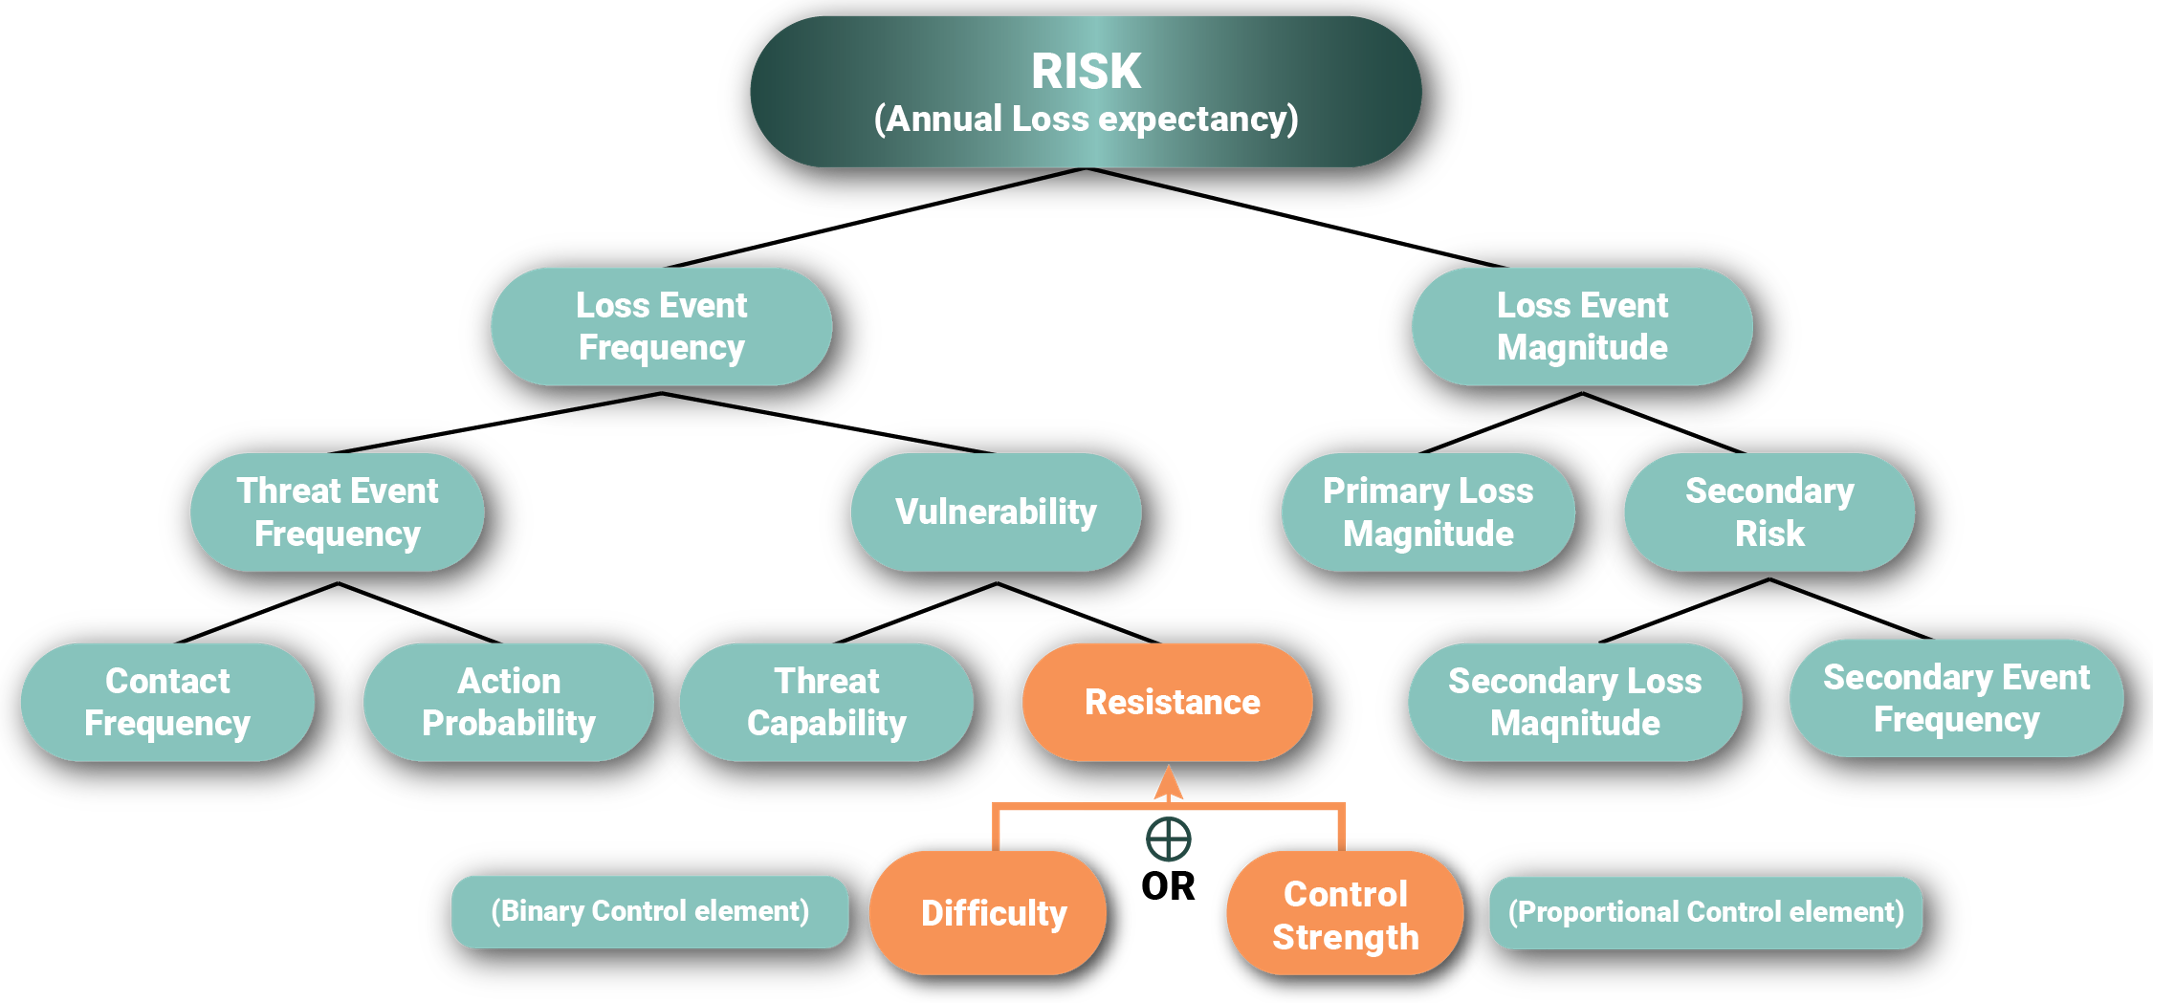
Additionally, adding flexibility and granularity to the model can be achieved by offering alternatives in modeling how Resistance of preventive security controls is calculated. Open FAIR™ CRQ models by default use Resistance Strength (also called Control Strength or Difficulty), together with Threat Capability, to calculate Vulnerability. This is adequate for security controls that are essentially binary in nature which provide little or no return until after a certain threshold value is achieved (e.g., implementing a ransomware control such as air-gapped backups). However, for the purposes of risk modeling the white paper suggests two benefits: by extending Resistance using a new proportional (instead of binary) control risk factor, residual risk can never exceed uncontrolled risk; and the benefits of incremental increase in Resistance often produce some reduction in risk.
Figure 1: Extending Resistance Using a New Proportional Control Risk Factor in the Open FAIR™ CRQ Models so Residual Risk can Never Exceed Uncontrolled Risk.
In summary
CRQ should not happen in a vacuum. It requires preparation to define the risk factors for each threat scenario. This is hard to do without some guidance pointing to best standards that aid to understand security capability maturity, gaps and desired capability targets required in scoping and defining the threat scenario variables. Using proportional Resistance control offers granular risk reduction and ensures CRQ outcomes cannot exceed uncontrolled risk.
For a deeper dive into the challenges, Download the Whitepaper Here.
[i] https://www.fairinstitute.org/what-is-fair
[ii] White paper – Calculating the Effect of NIST CSF Maturity Levels on Risk Reduction


